NINOS Education & Development has completed the analysis and reporting for the Annual Impact Measurerment (AIM+) FY26 Baseline for Wahana Visi Indonesia (WVI). The baseline sets the starting values for the Goal and four Outcomes of WVI’s 2026 to 2030 programme cycle, across 17 Area Programmes in four zones: Sambawa, NTT, West Kalimantan and Papua.
We have submitted the report to WVI in both Bahasa Indonesia and English. The assignment called for one analytical framework covering five sectors at once, and we want to share why this work matters, how we approached it, and what we learned.
About the AIM+ FY26 Baseline
AIM+ FY26 is the programme cycle baseline for WVI’s Country Strategy 2026 to 2030, which has a single overarching goal: children are resilient to face the future. The baseline measures conditions before implementation and covers 29 indicators at Goal and Outcome level.
Its scope is multisectoral. At Goal level, the baseline assesses household economic resilience, social cohesion and collective efficacy, and gender equitable attitudes. At Outcome level, it assesses child health and nutrition, drinking water and sanitation, foundational reading and numeracy, adolescent protection and empowerment, and social accountability and partner capacity.
Why This Baseline Is Different
Most baselines stop at a set of starting figures. WVI asked for more: a baseline that serves as the foundation for Contribution Analysis through 2030. WVI’s programmes combine several interdependent components, so a randomised experimental design is not an option. The baseline therefore had to test whether the programme logic holds before implementation starts, set the evidence trail to be checked each year, and map rival explanations from the outset.
Those rival explanations are real on the ground. The same areas host PKH cash transfers, supplementary feeding, free health checks, PAMSIMAS and STBM, along with seasonal patterns and other organisations’ programmes. We mapped all of them before the programme began, so that WVI’s contribution can later be separated from everyone else’s.
Objectives and Analytical Framework
The analysis follows the six steps of Contribution Analysis (Mayne, 2008). This baseline covers the first three: defining the attribution problem, developing and testing the Theory of Change, and gathering initial evidence. The remaining three are built through the annual reviews from FY27 to FY30.
Specifically, the analysis set out to:
- Establish starting values for 29 Goal and Outcome indicators, both as weighted national estimates and by Area Programme
- Test the Theory of Change for each Outcome against data collected before the programme began
- Prepare the comparison group: balance twelve household characteristics within each Area Programme so the group is ready for the FY28 midline
- Produce actionable recommendations for target setting, site prioritisation and midline preparation
The analysis pays particular attention to gender equality, disability and social inclusion, with data disaggregated by sex, age, urban and rural residence, sponsorship status and functional difficulty.
The analysis follows the six steps of Contribution Analysis (Mayne, 2008). This baseline covers the first three: defining the attribution problem, developing and testing the Theory of Change, and gathering initial evidence. The remaining three are built through the annual reviews from FY27 to FY30.
Specifically, the analysis set out to:
- Establish starting values for 29 Goal and Outcome indicators, both as weighted national estimates and by Area Programme
- Test the Theory of Change for each Outcome against data collected before the programme began
- Prepare the comparison group: balance twelve household characteristics within each Area Programme so the group is ready for the FY28 midline
- Produce actionable recommendations for target setting, site prioritisation and midline preparation
The analysis pays particular attention to gender equality, disability and social inclusion, with data disaggregated by sex, age, urban and rural residence, sponsorship status and functional difficulty.
Methodology: Integrated Statistical Analysis and Mixed Methods
WVI’s PEARL/MELC team and local enumerators collected the data between late April and early June 2026. NINOS received the cleaned data, then designed the analytical framework, ran the analysis and wrote the report. Our methods included:
Large scale survey : 19,777 questionnaire records from 18,714 households, covering household, caregiver, adolescent (12 to 18 years), under five, and water and sanitation modules. National estimates are weighted by the target population of each Area Programme.
Learning assessments : 1,299 children aged 7 to 14 assessed for foundational reading and numeracy, and 628 Grade 3 students assessed for reading proficiency, alongside data on the school reading environment.
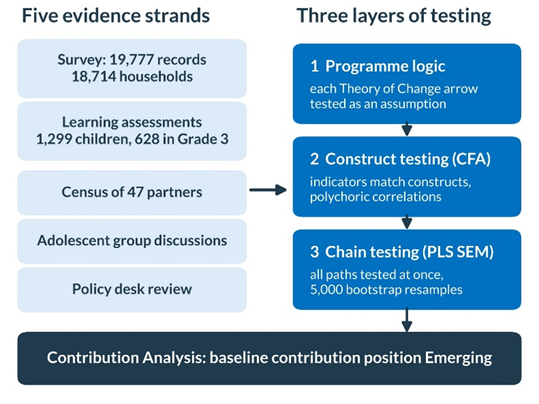
Construct testing and path models (CFA and SEM) : the analysis design specifies CFA to confirm that each Outcome’s indicators measure the construct the Theory of Change intends, using polychoric correlations because most indicators are ordinal. The chains from Outcome to Goal were then tested with PLS SEM (SmartPLS 4, 5,000 bootstrap resamples), supported by logistic, ordinal and linear regression to test rival explanations.
Partner capacity assessment : a census of 47 partner organisations using organisational capacity and safeguarding instruments, tabulated under the World Vision Global Centre rule.
Qualitative data and desk review : focus group discussions with adolescents, analysed through thematic coding, and a review of government policy and programmes in health, water and sanitation, education, child protection and social protection.
Key Findings
Eight of the ten links in the nutrition chain hold. The PLS SEM model of 634 households shows the strongest link running from community collective action to access to drinking water and sanitation, with a path coefficient of 0.302. The two links that did not hold are reported as they are.
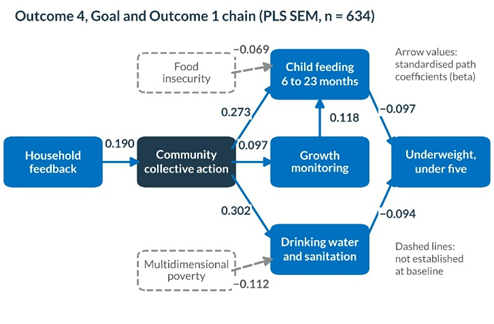
All three path models carry the same message: the chains are well connected at the community end and thin out towards the results. Each chain has one pivot: household contribution to shared services for Outcome 1, the home reading habit for Outcome 2, and adolescents’ relationships with their caregivers for Outcome 3. In nutrition, coverage is high but quality lags: minimum meal frequency reaches 83.0%, while minimum dietary diversity reaches only 45.0%. In education, numeracy is what holds back foundational skills, and in 16 of the 37 schools surveyed a Grade 3 child has no way to borrow a book.
We placed the contribution position at baseline as Emerging. Every pathway passes its hoop test, while the smoking gun tests cannot be passed yet because the programme has not started. The report also sets out what must be fixed before the midline, including six measurement defects, differences in indicator adoption across Area Programmes, and qualitative evidence that so far covers the Goal level only.
NINOS Research Team
NINOS is a multisectoral research and evaluation organisation working in education, health and nutrition, water and sanitation, child protection, adolescent empowerment and local systems strengthening. We combine large scale surveys, learning assessments, advanced statistical analysis such as CFA, SEM and regression, and qualitative methods within one framework. We believe good research does more than produce numbers. It helps clients understand which parts of a programme already work, where the chain of change breaks, and what should come first.
Interested in Working Together?
If your organisation is planning a baseline, an evaluation, a Theory of Change review or multisectoral data analysis, particularly for programmes that span many sites and outcomes, we would welcome a conversation.
📧 ninosindonesiafoundation@gmail.com | 🌐 ninosfoundation.org | IG @ninoseducation | 📍 Duren Sawit, Jakarta, Indonesia

 English
 Italian
 German
 Spanish
 Chinese (Simplified)
 Arabic
 Indonesian